Infographics

Chart: The Emissions in a Barrel of U.S. Oil
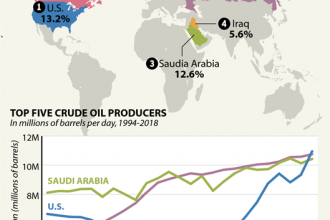
Chart: Top Crude Oil Producing Countries
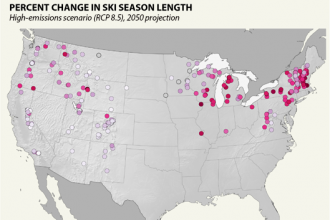
Infographic: Global Warming Means Shorter Ski Seasons
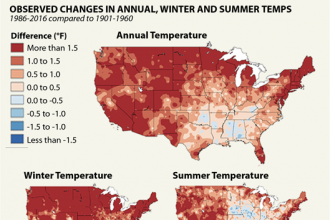
Map: Temperatures Already Rising in Ski Country
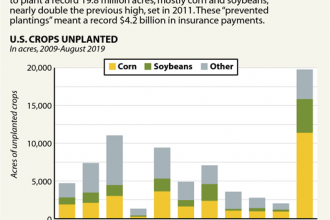
Chart: Floods Left Millions of Acres Unplanted
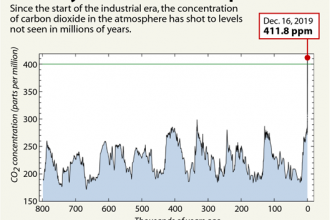
Chart: A History of CO2 in the Atmosphere
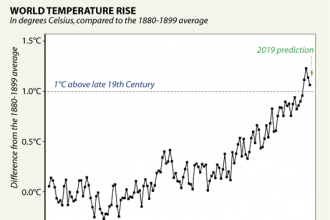
Chart: The Warmest Decade on Record
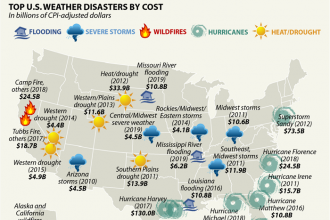
Map: Costliest U.S. Weather Disasters of the Decade
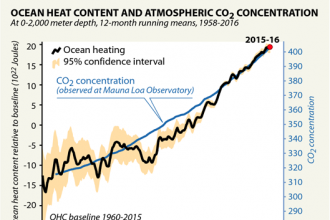
Chart: The Oceans Are Heating Up

2019 Year in Review
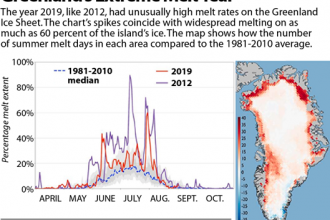
Chart: Greenland’s Extreme Melt Year
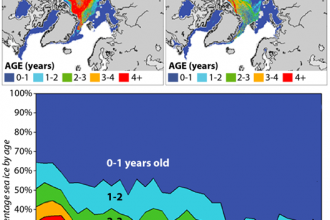
Maps: Arctic’s Multi-Year Sea Ice Is Disappearing
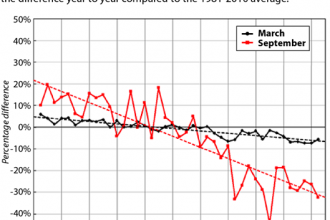
Chart: Arctic’s Declining Sea Ice Cover
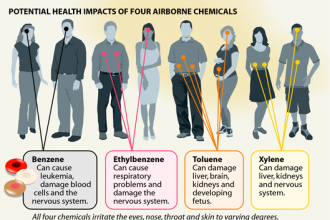
Infographic: Health Risks from VOCs
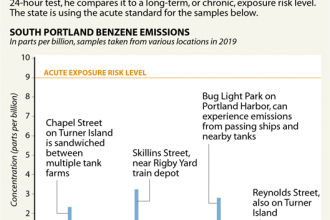
Chart: South Portland Emissions Levels and Risks
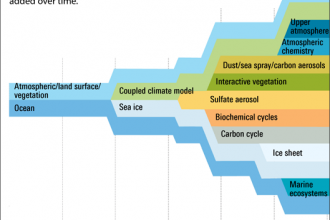
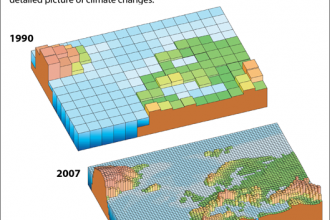
Graphic: The Growth of Climate Modeling