Infographics
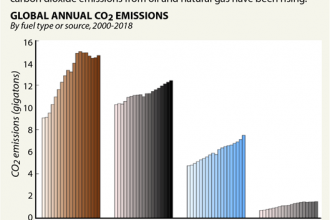
Chart: Which Fossil Fuel Emissions Are Rising?
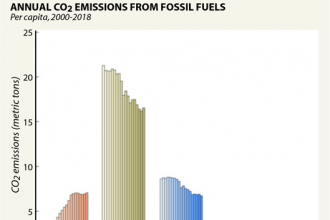
Chart: Which Country Emits the Most CO2 Per Person?
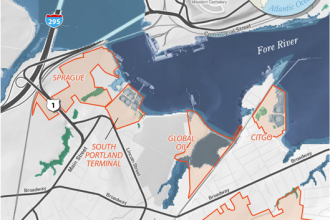
Map: Flood Risk and South Portland’s Petroleum Tank Farms
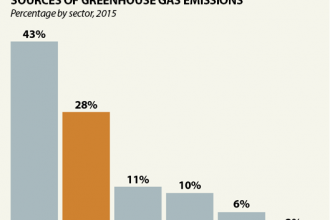
Chart: What Are Vermont’s Biggest Emitters
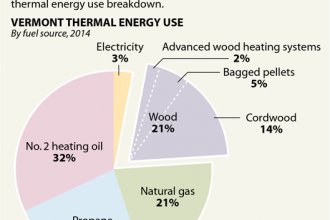
Chart: How Vermont Generates Heat
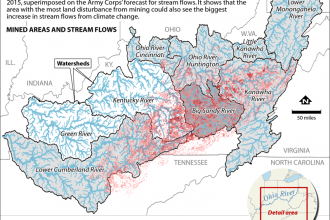
Map: Climate Change and Mountaintop Mining
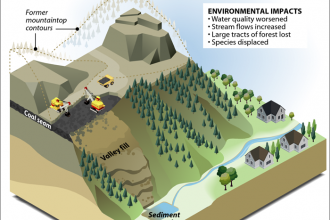
Infographic: When Mountains Are Leveled to Get at Their Coal
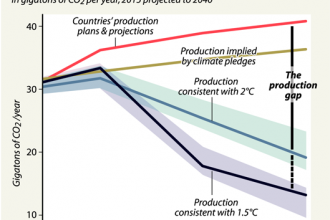
Chart: The Fossil Fuel Production Gap
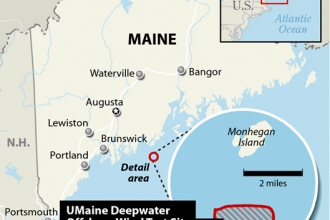
Locator: Maine’s First Offshore Wind Project
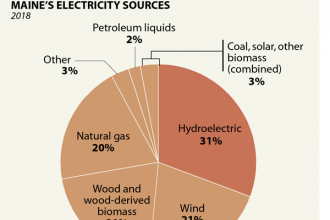
Chart: Maine’s Power Mix
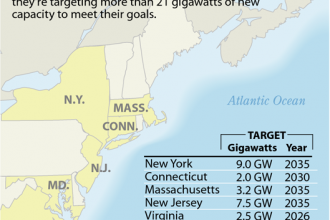
Map: The Northeast’s Offshore Wind Power Plans
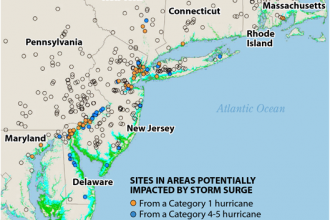
Map: Superfund Sites at Risk from Hurricanes
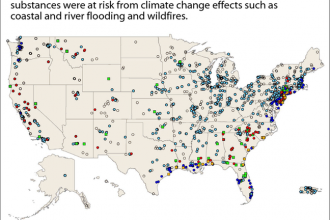
Map: Superfund Sites at Risk from Climate Change
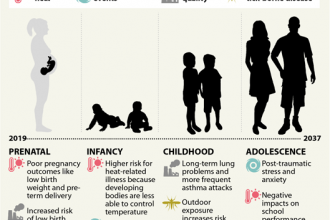
Infographic: Climate Change Risks to a Child Born Today
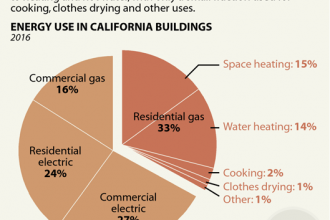
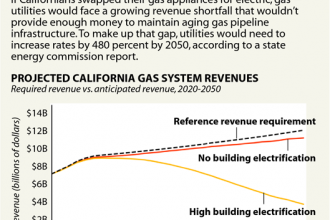
Chart: Energy Use in California Buildings
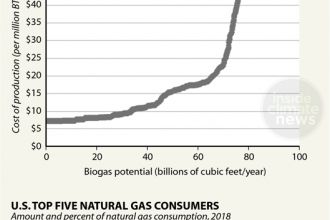
Chart: Limited Availability and Rising Cost of Biogas