Infographics
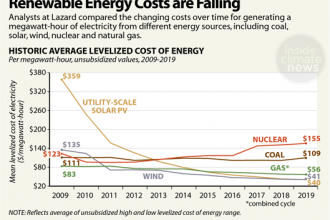
Chart: Renewable Energy Costs Are Falling
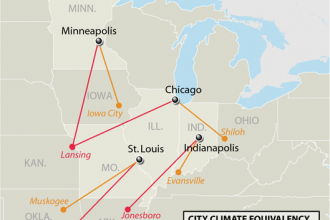
Map: The Midwest Climate in 60 Years
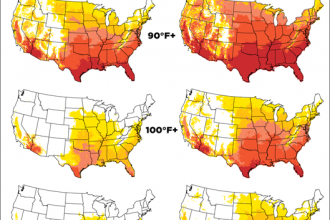
Maps: U.S. Forecast: More Extremely Hot Days Ahead
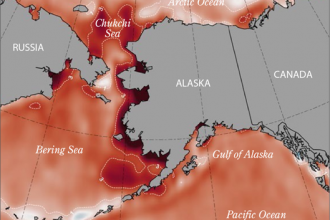
Map: Alaska’s Warming Oceans
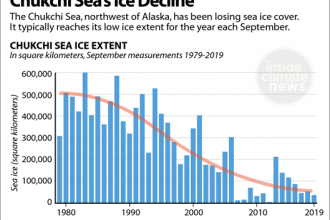
Chart: Chukchi Sea’s Ice Decline
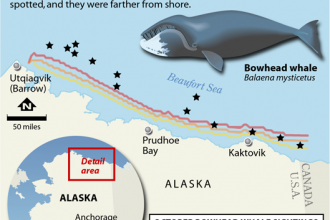
Map: Bowhead Whale Sightings 2019
Map: Bowhead Whale Sightings 2019
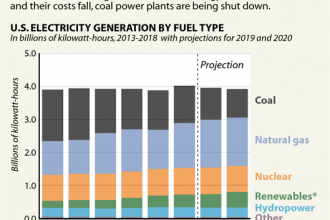
Chart: Coal’s Diminishing Role in the Power Sector
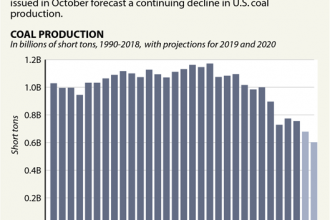
Chart: U.S. Coal Production’s Slide
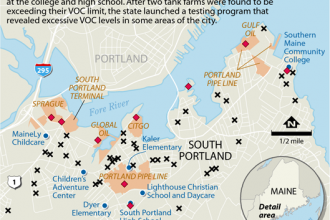
Map: Testing South Portland’s Air
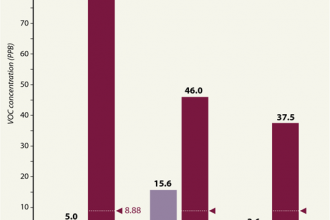
Chart: Testing South Portland’s Air
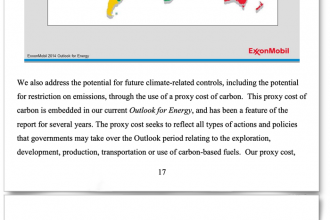
Excerpt: Exxon report
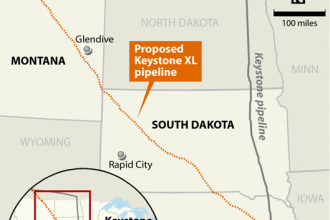
Map: Keystone XL Route
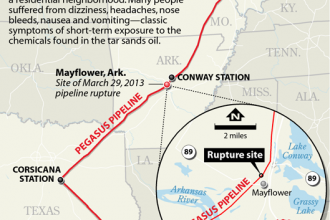
Map: Exxon’s Pegasus Pipeline
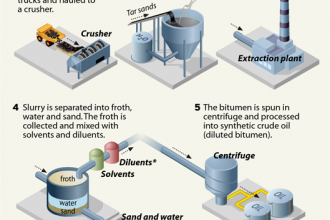
Infographic: Converting Tar Sands to Crude Oil

Health Risks from Heavy Crude Oil
