Infographics
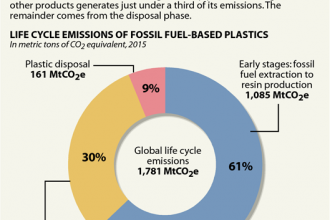
Chart: Plastic’s Life Cycle Greenhouse Gas Emissions
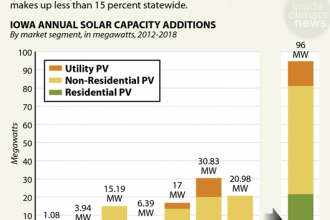
Chart: Iowa’s Solar Power: Where Is the Growth?
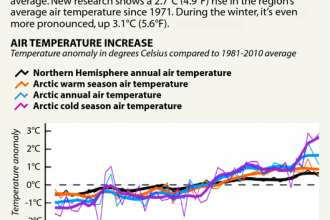
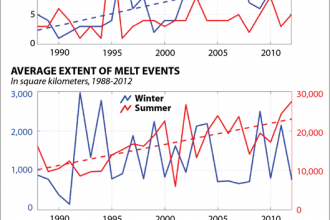
Chart: Arctic Temperatures Are Rising Fastest in Winter
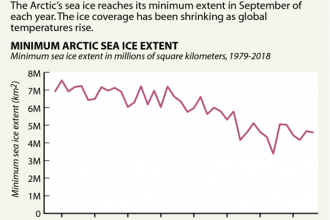
Chart: Arctic’s Shrinking Sea Ice Extent
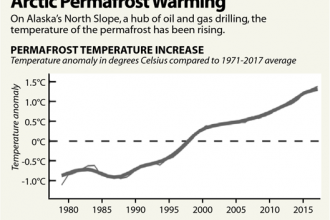
Chart: Temperature of Arctic’s Permafrost Is Rising
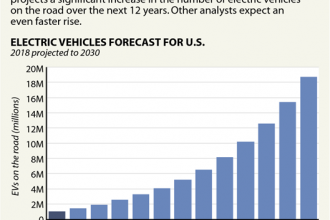
Chart: EVs on the U.S. Roads
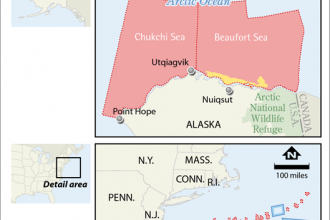
Map: Off-Limits to Offshore Drilling
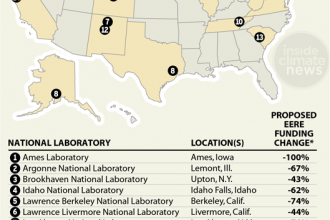
Map: Trump’s Proposed Cuts in Energy Efficiency and Renewable Energy at the National Labs
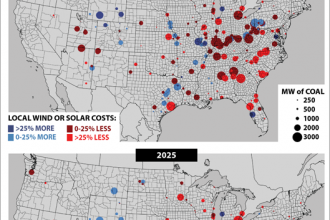
Map: Which Is Cheaper? Existing Coal Power vs. Building New Wind and Solar
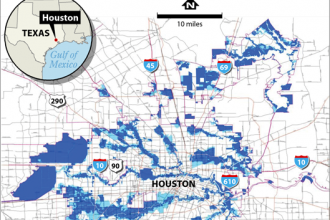
Map: Houston Strengthens Its Floodplain Building Rules
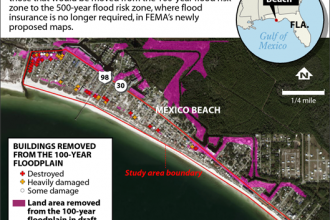
Map: Mexico Beach and FEMA’s Changing Flood Zones
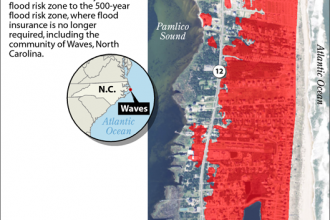
Map: Outer Banks and FEMA’s Changing Flood Zones
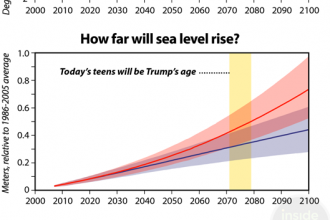
Charts: What Does the Climate Future Look Like for Today’s Teens?
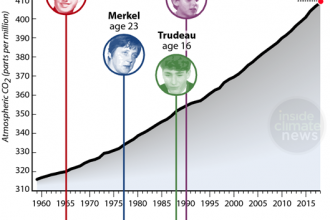
Scientists Were Warning About Climate Change When World Leaders Were Teens
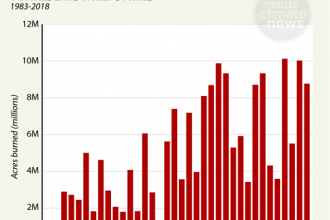
Chart: Wildfires Burning More U.S. Wildland
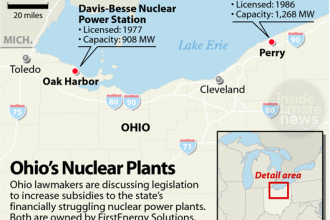
Map: Ohio’s Nuclear Plants