Infographics
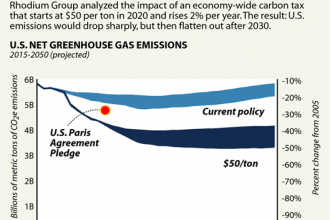
Chart: 2 U.S. Carbon Tax Proposals Compared
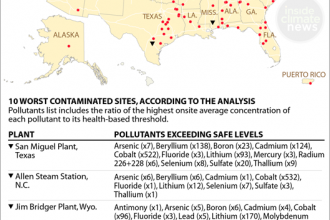
Map: Coal Ash Sites Linked to Groundwater Contamination

Charts: Rising Ocean Temperatures Don’t Bode Well for Fisheries
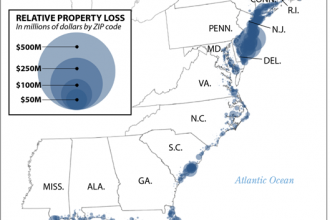
Map: Sea Level Rise Is Eating into Property Values

Plastics: From the Gas Well to Your Home
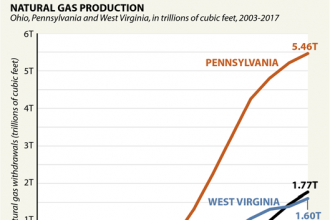
Chart: 3 States’ Natural Gas Boom
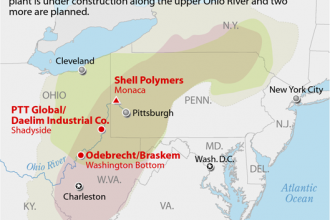
Map: Ethane Cracker Plants on the Ohio River
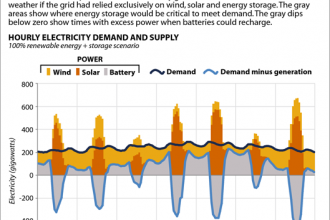
Chart: How an All-Renewable Energy Power Grid Could Handle the Polar Vortex
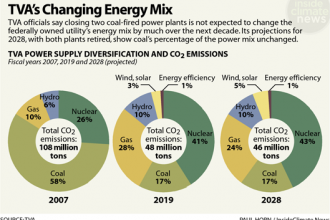
Charts: TVA’s Changing Energy Mix
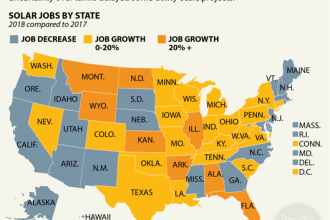
Map: Where Are Solar Jobs Growing Fastest?
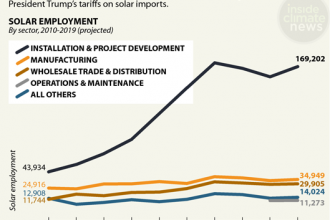
Chart: Rise of U.S. Solar Installation Jobs
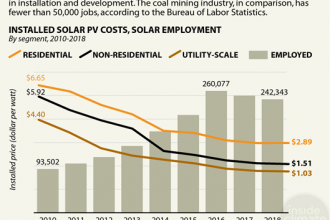
Chart: Solar Jobs Rose as Prices Fell
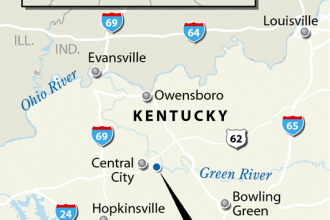
Map: Paradise Fossil Plant, Kentucky
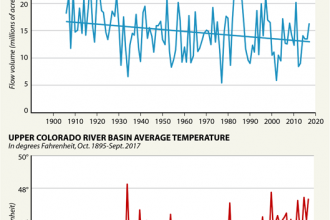
Chart: In the Colorado River Basin: Less Water, Rising Temperatures
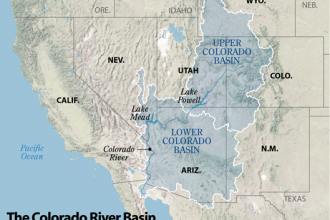
Map: The Colorado River Basin
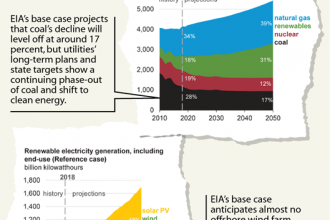
Chart: Is EIA Underplaying Shifts in Coal and Renewable Energy?