Infographics
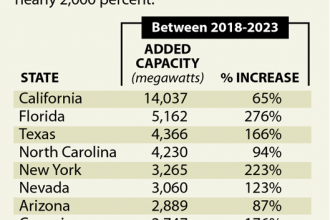
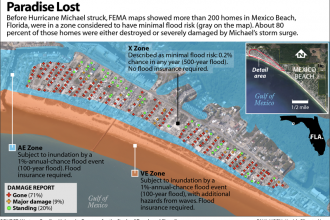
Chart: Which States Are Adding the Most Solar Capacity?
Chart: Energy and Climate Change on the 2018 Ballot
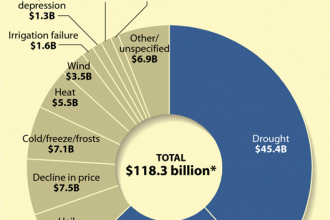
Graph: What’s Sparking Crop Insurance Payouts?
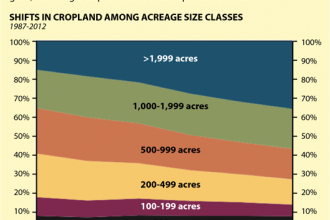
Graph: America’s Farms Are Getting Bigger
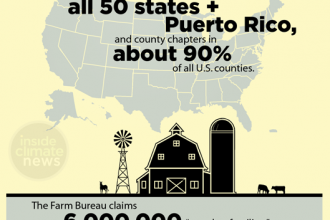
Graphic: The Farm Bureau at a Glance
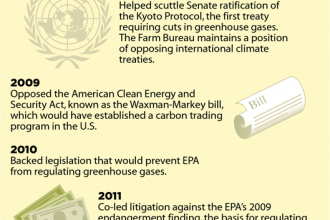
Graphic: The Farm Bureau’s Decades of Climate Policy Opposition
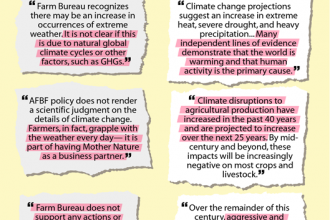
Graphic: Farm Bureau vs. National Climate Assessment
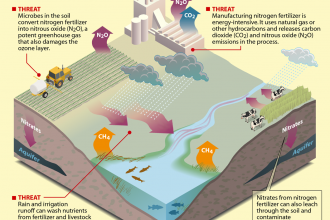
Infographic: The Triple Threat of Nitrogen Fertilizers
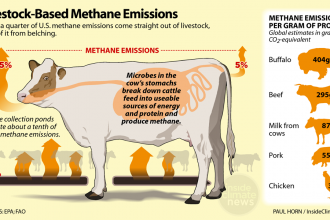
Infographic: Livestock Produce Large Amounts of Methane Gas
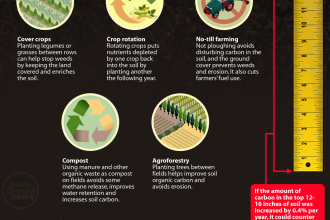
Infographic: Soil’s Carbon Storage Can Help Fight Climate Change
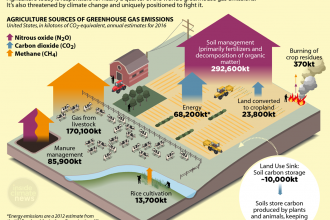
Infographic: How Agriculture and Livestock Contribute to Climate Change

On Climate Science: Farm Bureau vs. National Climate Assessment
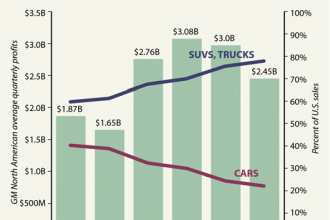
Chart: GM Shifts from Cars to Trucks and SUVs
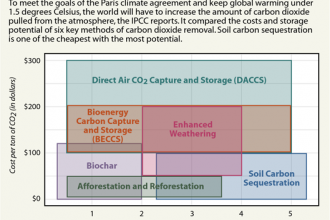
Chart: How Do Carbon Storage Techniques Stack Up?
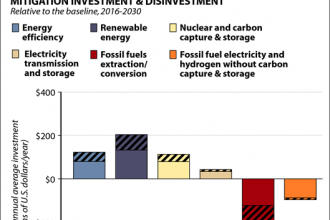
Chart: How Does Energy Investment Need to Change to Keep Warming Under 1.5°C?
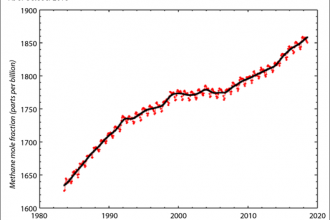
Chart: Global Methane Emissions Are Rising