Infographics
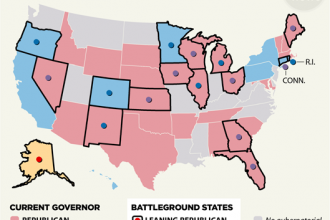
Map: 2018 Governor’s Races — The Battleground States
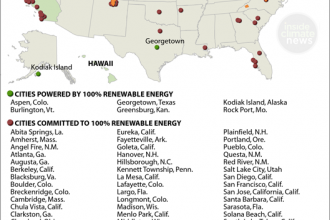
Map: U.S. Cities with 100% Clean Energy Commitments
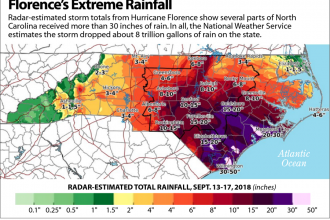
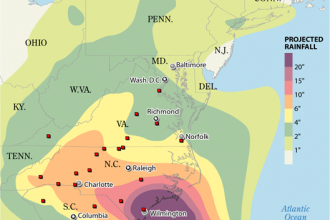
Map: Florence’s Extreme Rainfall
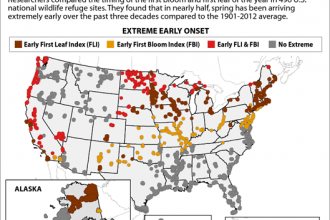
Map: Spring Is Coming Extremely Early to These U.S. Wildlife Refuges
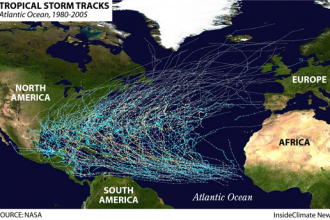
Map: 25 Years of Atlantic Tropical Storm Tracks
Map: Coal Ash Sites in Hurricane Florence’s Path
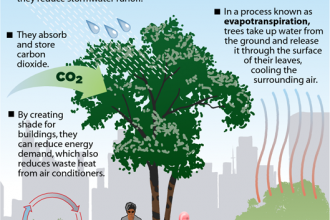
Infographic: Why Trees Are So Cool
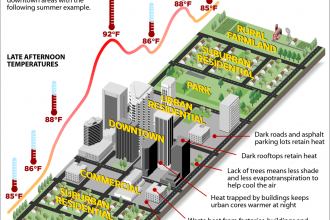
Infographic: The Urban Heat Island Effect
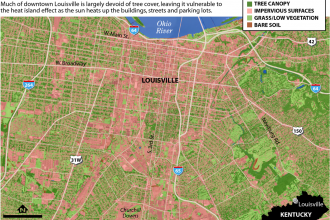
Map: Louisville’s Changing Tree Cover
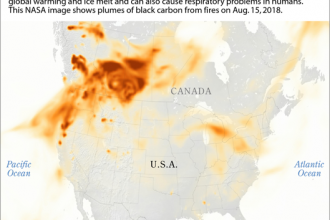
Map: Winds Can Carry Black Carbon from Wildfires Far from the Source
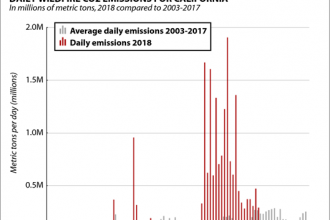
Chart: Daily CO2 Emissions from California’s Wildfires
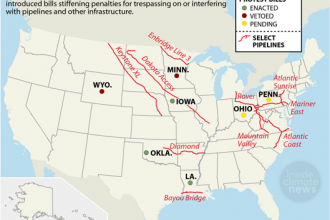
Map: At Least 7 States Considered Legislation Targeting Pipeline Protesters
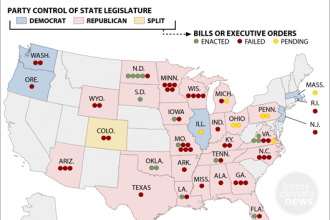
Map: 31 States That Have Proposed Laws Targeting Protests
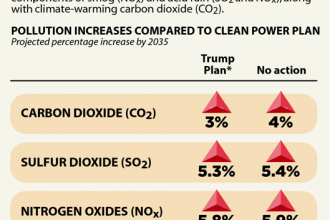
Chart: Health-Damaging Pollutants Rise Under Trump’s Climate Plan
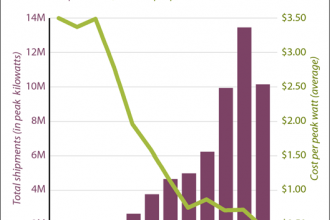
Chart: Falling Solar Prices, Rising Solar Module Shipments, 2006-2017
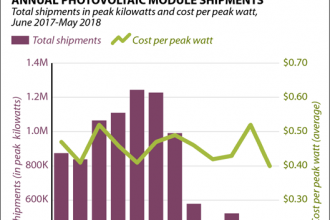
Chart: Solar Prices and Solar Module Shipments, 2017-2018