Infographics
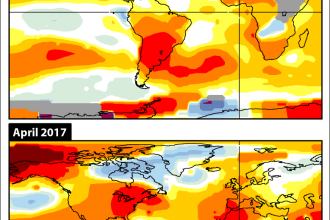
Maps: 2018 Hurricane Season Starting with Cooler Sea Surface Temps
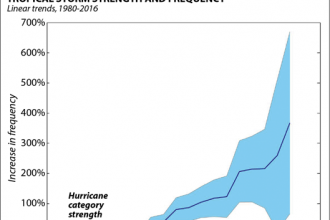
Chart: Strongest Tropical Storms Have Grown More Common Since 1980
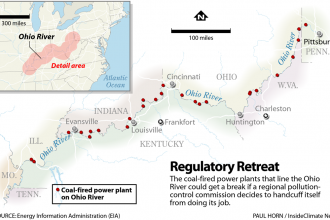
Map: Coal-Fired Power Plants on the Ohio River
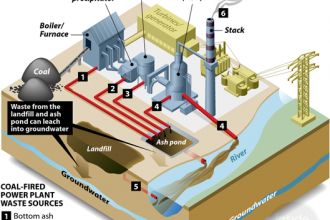
Toxic Waters: Pollution Sources from Coal-Fired Power Plants

Map: Water Keeps Returning to Norfolk’s Historic Shorelines
Animation: What Will Sea Level Rise Look Like in Norfolk, Va.?
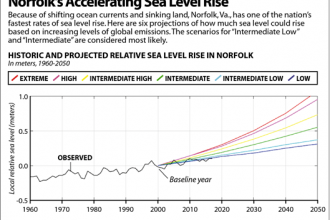
Norfolk’s Accelerating Sea Level Rise: 6 Pathways
Animation: Changing Habitat for Atlantic Cod by 2100
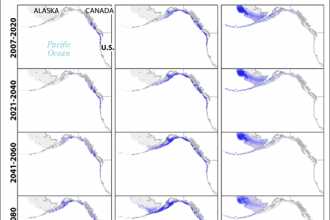
Fish Migration: Where are West Coast Species Headed as Temperatures Rise?
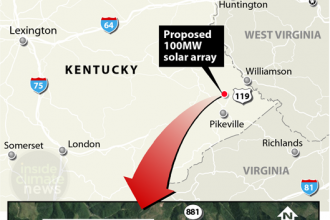
New Energy from Damaged Mountains
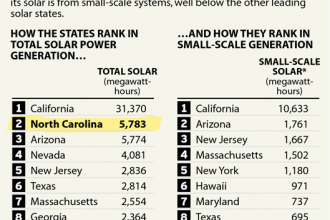
Solar States: Rankings by Overall Capacity and Small-Scale Solar
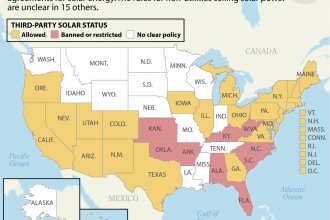
Which States Restrict Third-Party Solar?
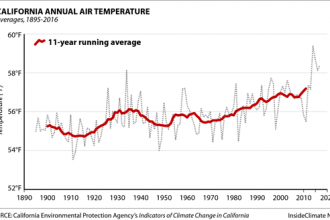
Chart: California’s Temperature Is Rising
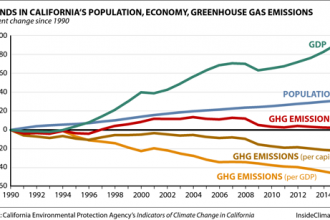
Trends in California’s Population, Economy and Greenhouse Gas Emissions
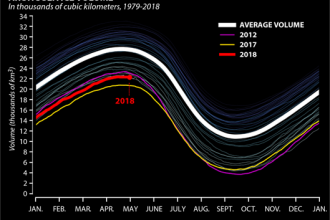
Chart: Sea Ice Volume in the Arctic
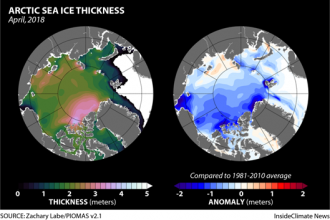
Maps: Sea Ice Thickness in the Arctic