Infographics

Chart: Busy Beavers
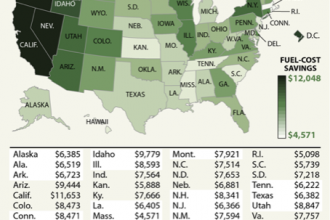
Map: EV Fuel Cost Savings Vary Widely State to State

Map: Making Progress on Pollution

Map: Health Inequities in Louisville
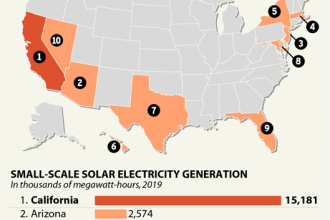
Map: Leaders in Small Solar

Map: How to Split an Ozone Zone
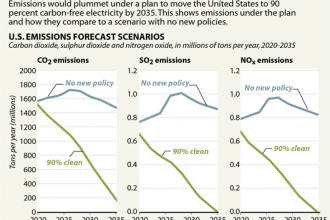
Chart: Cutting Emissions
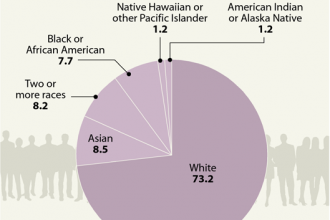
Chart: Solar Worker Demographics

Chart: An Ongoing Problem

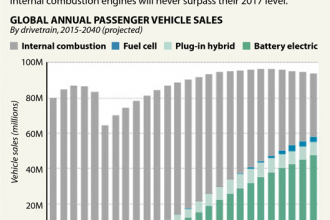
Chart: A Rapid Rise, and Scandal

Map: Drought Forecasted for U.S. Southwest

Chart: Record Levels of Atmospheric CO2

Chart: Extreme Rainfall Increasing Over U.S.

Infographic: Understanding Vapor Pressure and Emissions from Heated Storage Tanks

Infographic: Antarctic Climate Cues

Infographic: PM 2.5: Tiny Particles, Deep Impact