
Infographics

Map: Gas Leaks Linked to Tree Death

Chart: Covid-19’s Impact on Global Carbon Emissions

Map: Where Hurricanes Pose a Growing Threat

Infographic: Keeping Things Cool: The Albedo Effect

Map: MOSAiC Follows Nansen’s Lead
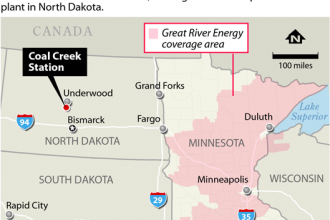
Map: Closing Coal Creek Station
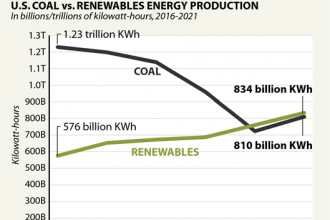
Chart: Renewables Rising

Chart: Alaska Oil Production Ends Its Slide
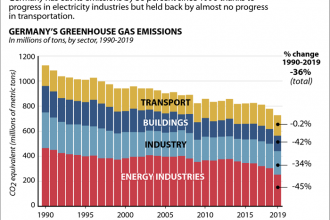
Chart: Germany Emissions Continue Downward
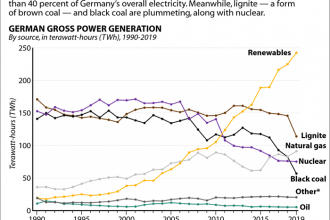
Chart: The Rise of Renewables

Infographic: Warmer Days, Warmer Nights

Map: Double Trouble

Map: People of Color Cope with Bad Air, Coronavirus

Chart: Weather-Related Deaths
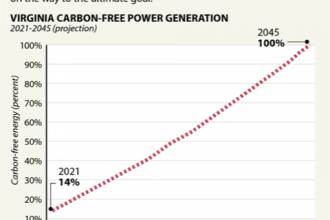
Chart: Virginia’s Path to Carbon-Free Electricity
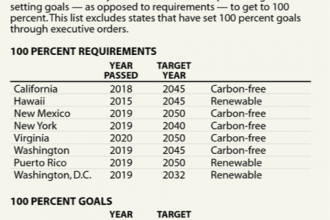
Infographic: The ‘100 Percent’ Club
