


This story is a partnership between Inside Climate News, Grist and WBEZ.
Chicago has a lead pipe problem.
The city estimates that about 412,000 out of roughly 491,000 water service lines require replacement because they are known or suspected to contain lead. That’s the most of any city in the country.
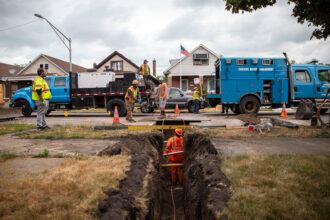
Service lines are the underground pipes that connect the city’s water main to your home’s internal plumbing. When these and other plumbing materials contain lead, tiny pieces of the toxic metal can dissolve or flake off into the water coming out of your tap.
The city offers a lookup tool where residents can search their address to see what their service line is made of.
But that information has never before been publicly mapped in a way that shows how the problem with lead service lines is distributed across Chicago and how that intersects with poverty and race.
To that end, Inside Climate News, Grist and WBEZ have analyzed city data obtained through a public records request to create an enhanced lookup tool that not only allows Chicagoans to search their own address to find out their risk, but also to see where the problem is most acute and to compare lead pipe distribution against race and poverty.
Scroll down for information on how to navigate our lead service line map, where the data comes from and how we analyzed it, and what to do if your service line may contain lead.
How This Story Came About
Last year, federal safe-drinking-water rules required for the first time that all water systems in the country (the local bodies responsible for water infrastructure) take stock of their service lines and create inventories identifying their materials to submit to the U.S. Environmental Protection Agency. These inventories were the first step in the EPA’s new mandate for water systems to replace all of their lead service lines.
In Illinois, a state law further requires water systems—including Chicago—to submit a yearly inventory update to the Illinois EPA alongside a plan detailing the proposed strategy for replacements.
Coming Soon
We will continue investigating Chicago’s lead pipe crisis. Sign up to be notified when we publish more reporting.
Have you been affected by lead pipes or lead exposure in Chicago? Tell us what happened.
Guided by questions from residents and community organizers, we knew that this data could illuminate not only where Chicago stands in dealing with its lead pipe problem, but also important information about how the work is being carried out.
Through Freedom of Information Act requests to Chicago’s Department of Water Management and the Illinois Environmental Protection Agency, we obtained the city’s most recent service line inventory, submitted to the state in April; service line replacement data; and the city’s 2025 replacement plan.
To connect these documents to residents’ experiences living with lead pipes and trying to get them replaced, we conducted dozens of in-person and remote interviews with policy and legal experts, public officials, scientists, advocates and Chicagoans living with dangerous lead service lines.
What We Found
According to the city’s submitted plans, Chicago aims to fully replace the city’s lead service lines by 2076—completing 8,300 replacements annually for 50 years, starting in 2027. That puts the city 30 years behind the timeline mandated by the EPA.
The EPA not only mandates a replacement plan, but also requires water systems to send out notifications to residents if their service line is confirmed to be made of lead; if it’s galvanized steel, which can accumulate lead from upstream plumbing; or if the material of their service line is unknown.
So far, Chicago has only started sending letters to homes with confirmed lead service lines, and as of early July only about 62,000 of 900,000 notices that were due last November had gone out. More than 90 percent of at-risk Chicagoans haven’t been told their drinking water could be unsafe.
While lead pipes are a problem across the entire city, comparing service line data to census tracts and community areas revealed that 92 percent of service lines require replacement in majority-Latino census tracts. In majority-Black tracts, the figure is 89 percent. That compares to 74 percent of service lines in majority-white census tracts and 65 percent in the city’s nine majority-Asian tracts in and around Chinatown.
Among the worst affected are neighborhoods on the South and West Sides. The nine community areas with the highest percentage of pipes requiring replacement are all on the South Side. The 10th is Belmont Cragin, a majority-Latino neighborhood on the Northwest Side.
Read More About Our Findings on How Lead Correlates To Race and Poverty

Chicago Has a Huge Lead Pipe Problem—and We Mapped It
By Keerti Gopal, Juanpablo Ramirez-Franco, Peter Aldhous, Clayton Aldern, Amy Qin
Explore the map below, or keep scrolling for more on how to use the map and what to do if you’re at risk.
How to Use This Map
This map shows the concentration of confirmed and suspected lead service lines across Chicago, alongside distributions of race and poverty.
Using this interactive tool, you can see how the lead service line problem varies across the city at the level of census tracts and the city’s 77 community areas. Switch layers to see how lead pipe distribution relates to poverty and race.
To see your own service line status or to look at specific locations, enter a Chicago address to see its service line material.
For available addresses, the search tool will reveal the composition, if known, of the three components of the line or lines serving that location: the gooseneck, a flexible curved pipe that connects to the water main; the public-side line, owned by the city, which runs under the sidewalk; and the private-side line, which runs into the building, connecting to the internal plumbing. The Department of Water Management classifies entire service lines based on its knowledge about these components, putting them into one of four categories:
- Lead: At least one component of the service line is known to be made of lead.
- Suspected Lead: The composition of the service line is unknown, but is suspected to contain lead components, usually based on the building’s age.
- Galvanized Requiring Replacement: No components of the service line are known to be made of lead, but at least one part is made of galvanized steel, which can become contaminated with lead from upstream pipes.
- Non-Lead: None of the components of the line are made of or may be contaminated with lead. These are the only service lines that do not require replacement and are in the minority across most of the city.
The map is based on the Department of Water Management’s service line inventory, submitted to the Illinois Environmental Protection Agency on April 14, 2025, and will not reflect replacements after that date.
Many household addresses are missing from this inventory list because in many cases a single service line can serve multiple households. Some service lines are also logged in the inventory by the nearest intersection rather than a numbered street address.
If your address does not appear, the tool will allow you to view nearby lines, which may include those serving your building.
If I’m a Concerned Resident, What Can I Do With This Information?
Use our map or the city’s lookup tool to check if your home has a lead service line. As both tools are based on the city’s inventory data, they are incomplete and may contain inaccuracies. You can independently verify the material of your own service line using this guide from the city, and submit photos to the water department to update your information in the service line inventory.
If your address is known or suspected to have a lead service line, you can request a free testing kit from the city to confirm your eligibility for some city programs. You might not get the results back quickly. But city officials use the rate of requests as one way to understand interest in and concern about this issue from residents, so submitting them can be an important signal.
Depending on the results of your testing and your household income, help can include a fully subsidized replacement of your service line or a fee waiver for homeowners initiating their own replacements.
As a service line is only one of many plumbing fixtures that can bring lead into your water, you should also investigate the material of other pipes, valves and faucets in your home.
Experts suggest that all Chicago residents filter their water using a product certified to remove lead. It’s important to replace filters regularly, as they become less effective over time. Do not run hot water through your filter—hot water can dissolve more lead from pipes than cold water—and use cold water for drinking, cooking and making baby formula. Boiling water does not remove lead. Some residents may qualify for a free water filter set from the city.
Steal Our Methods: How We Made the Interactive
To make these maps, Inside Climate News, Grist and WBEZ started from the inventory of water service lines submitted by the city of Chicago to the Illinois Environmental Protection Agency in April 2025.
The spreadsheet we received contained records for 491,705 service lines. We first cleaned and standardized the addresses, removing inconsistently applied elements, such as individual units, to give a street address with a single number—or range of numbers, representing buildings or larger developments covering multiple numbered addresses. Almost 300 lines in the inventory were identified by a street intersection rather than a numbered address.
Census and community area comparisons
We then ran these addresses and intersections through the U.S. Census Bureau’s geocoder, obtaining latitude and longitude coordinates for more than 489,000 service lines. For those that failed to process, we tried other geocoding services (Bing Maps, HERE, ArcGIS and Geocodio) or found their locations manually. Ultimately, we obtained acceptably accurate latitude and longitude information, locating the address at least to the nearest city block, for all but 21 of the service lines in the inventory.
We then mapped each geolocated service line to its census tract and to one of the city’s 77 community areas. The Census Bureau geocoder returned census tract identifiers directly; for lines geocoded using other services, and to map service lines to community areas, we performed spatial joins using geographic information system software.
For each census tract and community area, we calculated the total number and percentage of service lines requiring replacement, using the percentage values to create our service line map layers.
On the interactive map, you can switch between these layers and layers illustrating the percentage of people in poverty or the percentage of people who don’t identify as white alone. We obtained this data at the tract level from the Census Bureau’s 2019-2023 5-year American Community Survey. For community areas, which do not overlap neatly with census tracts, we aggregated tract-level data on race and poverty to the larger community areas based on the share of each tract’s population that resides in each community area.
Individual address lookup
Our interactive service line map uses an indexed search system that reconciles geocoded addresses with the city’s inventory data. Since geocoding services often simplify ranged addresses (like “5408-5412 N KENMORE AVE”) to just their starting number, our system reconstructs complete addresses by combining the geocoder’s output with the original street number ranges from the inventory data.
These reconstructed addresses are normalized—converted to lowercase, punctuation removed, abbreviations standardized (“Avenue” to “Ave”)—and indexed multiple ways: by full address for exact matches, by street name for partial searches and by number ranges so searching for any address within a range correctly identifies the appropriate service line record. When you search or click an address, the system looks up this normalized form in the pre-built index to retrieve the service line’s material composition.
When the indexed inventory search doesn’t find a match—usually because you’ve entered an address not in the water service line database—the system automatically falls back to Nominatim, an open-source geocoding service based on OpenStreetMap data. This fallback helps you locate and zoom to any Chicago address, even without associated service line information.
Our system sends your query to Nominatim, which returns the best matching location with coordinates, formats the result to match our standardized address format and displays it as a search suggestion. When you select a Nominatim result, the map zooms to that location, helping you orient yourself and explore nearby areas where service line data is available.
Further details on our interactive map methods and code are available in our GitHub repository for the application.
About This Story
Perhaps you noticed: This story, like all the news we publish, is free to read. That’s because Inside Climate News is a 501c3 nonprofit organization. We do not charge a subscription fee, lock our news behind a paywall, or clutter our website with ads. We make our news on climate and the environment freely available to you and anyone who wants it.
That’s not all. We also share our news for free with scores of other media organizations around the country. Many of them can’t afford to do environmental journalism of their own. We’ve built bureaus from coast to coast to report local stories, collaborate with local newsrooms and co-publish articles so that this vital work is shared as widely as possible.
Two of us launched ICN in 2007. Six years later we earned a Pulitzer Prize for National Reporting, and now we run the oldest and largest dedicated climate newsroom in the nation. We tell the story in all its complexity. We hold polluters accountable. We expose environmental injustice. We debunk misinformation. We scrutinize solutions and inspire action.
Donations from readers like you fund every aspect of what we do. If you don’t already, will you support our ongoing work, our reporting on the biggest crisis facing our planet, and help us reach even more readers in more places?
Please take a moment to make a tax-deductible donation. Every one of them makes a difference.
Thank you,